Could On-site Excel Training The Best Solutions For Your Organisation?
Business Analysis Made Easy. So Stop Presenting Outdated Business Reports To Your Boss!
From Jason Khoo
Dear Friend,
Business Analysis is not only about churning report after report and presenting them for decision making. The key to professional business analysis is the quality of the report and how accurate and up-to-date are the contents of the report.
“Here Is How You Can Quickly And Easily Prepare Your Business Reports Using Real-Time Data, Guaranteed To Impress Your Audience, Without Having To Acquire New Software.”
Imagine your boss asking you to prepare a sales report. And you spent 3 weeks to prepare it, from collecting data from your your IT to presenting the report. And when you show it to your boss, you realized that was not exactly what he was looking for!
You spent another 3 weeks to produce another report, hoping to meet your boss’ requirements this time. And guess what, your boss was unhappy that the data has become outdated
We all can imagine that frustration after having invested so much time on a report? But, you can choose not to be in this situation; you can be like Agnes, a participant of our course.
|
“I used to spend quite some time and efforts compiling the volunteers’ contribution. With the use of the pivot table / chart function, meaningful reports can now be ready in less than a minute.” Agnes Tan from Singapore Heart Foundation |
You may say:
“Easier said than done. Data in the real business world is never perfect. I have to clean up the data first before such a report can be created.”
I totally agree! because you could be given more information than what you asked for OR the information could be given in separate files. And to combine all the data into a report, you probably have to do it manually now.
What if I tell you that there are shortcuts to cleaning the data you have and that you could easily produce those high-quality reports for your presentatione? As former business analyst, I used to be in your shoes. That’s why we know your problems and want to share with you how to extract details from the data that you have and how to combine twoor more sets of data into one to save time and resources in creating high-quality reports.
|
In my day-to-day planning function, I have to manage a lot of data, to translate these data into meaningful reports for analysis and planning purpose. This course has enabled me to use some useful formulas and functions to get the report I want in a reduced time. Lynn Soon from Acushnet Singapore Pte Ltd |
|
In my organisation, we need to analyse and present data at a regional level. However, our data is only available in separate tables by country . I learn how to merge data from these files and present them at a consolidated level. The pivot charts are also very useful in presenting our KPIs on a regular basis. Patrina Kuek from Acushnet Singapore Pte Ltd |
To prepare your monthly reports, have you been exporting data from your ERP or Finance systems and then importing them into Excel?, Now there is an easier and better way to get the data into those monthly reports without having to do anymore importing and exporting. Here is what Lay Kun has found out from our course:
|
Learning MSQuery allows me to save lots of report processing time. And there are new things to learn, even in areas that I thought I am familiar in, e.g. pivot tables. Ley Kun from Reuters Asia Pte Ltd |
As you would agree, “A picture tells a thousand words”. Putting the right message across to your audience using charts is definitely going to help you catch your audience’ attention. With thousands of ways to present your report, you must choose the one chart that will impress your audience to take a second look at your report. To make one chart, you would only take a few minutes for entering the data and doing the plotting. But producing many of those charts just to select the best has never been easy. It can easily take up hours of your time to just do that
And here is a chart that shows the time savings of our participants which they reported they could achieve after attending our training:
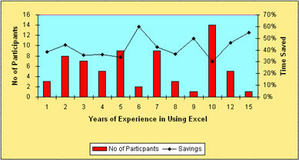
Now, the pivot chart. This is not a normal chart. Its dimensions can change by using the popular drag and drop function. And the chart is updated every time the data changes. Pradip has this to say after attending the course:
|
We use Pivot tables often. This course has helped me use the pivot tables extensively and made charts from the pivot tables as well. Quite often, charts are well understood and convey the essence of presentation. Moreover, charts are also interactive and get updated when the base data change. Pradip Muchhala, Financial Controller from Philips Semiconductors Singapore Pte Ltd |
Think about it. Turning those data into valuable and accurate business information without using additional sofware is the most powerful skills you could ever learn. For the price of a cup of coffee – thiscourse will show you how to prepare a professional report to your target audience. It is a skill you cannot do without in your job.
But You Cannot Learn IF You Do Not Know It Exist…
Instead of knocking yourself out trying to learn the skills on your own, you can now have this collection of videos that will show you how to do it right instantly — announcing:
“Sales Performance Analytics with Excel”
This is a collection of videos that will impart to you the skills of business analysis using Microsoft� Excel, perfected over the years after numerous trials and errors.
At last! The secrets to prepare Exceptional Quality Reportsusing Excel are revealed to you…..
But don’t take my word for it, here’s what our customers are saying about this unique Advanced Excel Training Course:
Maybe you are like a project director like Adrian who uses the skill to manage his sales data:
|
“Before, I had to manually merge data. Now with Vlookup, merging data and manipulating them is a breeze!”Adrian estimates that he saves about 80% of his time on his analysis and reporting.” Adrian Lau, IIR Exhibitions Pte Ltd |
Or an inventory analyst like Vivien:
|
“Vlookup helps me to reconcile stock reports from my external warehouse. It is very productive as the reconciliation takes less time when you have a LONG list of inventory.”Pivot Table gives me the basics of creating our shipment planning forecast. A very benefiting tool for segregating data you require. Vivien estimates that she could achieve a savings of 30% Vivien Chong, Taytonn Pte Ltd |
Or perhaps, you are like Hazel:
|
IF Formula and VLOOKUP formula are very useful for my reports. They reduce compiling time by almost 40%. Though I have been using excel for many years, the course teaches me a couple of tips that I did not know. Hazel See, W L Gore & Associates |
It is also highly possible that you are working in a new start-up like Cindy:
|
“I used to use different tabs to segregate data for different customers. I realised that just by keying in the same worksheet, I can manipulate (organised) the data using pivot table. Extremely useful for start-up/organisation that doesn’t run on SAP/MRP etc. Excel can be a comprehensive tool to evaluate/analyse data with basic data entry. Cindy achieves savings of about 70%.” Cindy Chong, Taytonn Pte Ltd. |
You might be working in an established company with a comprehensive system like Rosalind
|
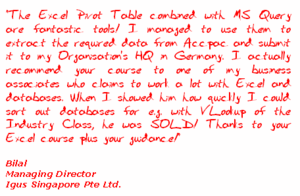
“I learnt how to use the F4 function key to rotate between absolute references and relative references, the subtotal key, copy key by double clicking the mouse button. I can use the pivot table feature in excel to try on our ACCPAC system to extract the info we need. Rosalind could achieve a savings of about 50%.” Rosalind Koh, Igus Singapore Pte Ltd |
I know you’re probably still skeptical and a bit on the conservative side, but think about this – if you keep doing the same things over and over again – you’ll only succeed in getting the same results. That’s why I want to let try out my proven training course – completely and totally risk-free! (I’ll tell you about my unique guarantee in a moment.)
Which Of These Powerful SecretsCould You Learn From Business Analysis with Microsoft® Excel?

Create reports that refresh by themselves.
Prepare a quantitative report in 3 steps.
Copy your formula to 65,536 rows in 1 second.
Learn how to create a report in 15 seconds.
How to separate your data (contained within a cell) in 3 simple steps.
Merging Data from 2 different worksheets
Find the unique list for your data in 5 seconds.
Okay, So What’s The Cost For This Incredible Resource?
Well, realize that this advanced Excel training course could easily sell for hundreds of dollars. Every 2 hours you saved per week could generate into a saving of $2,727 per annum.
But I’m not going to charge you anywhere near that amount or even my minimum price for training. In fact, your total investment for Sales Performance Analytics with Excel is only US$47.00 The skills you learn can easily pay you back at 58 times your meager investment.
So what’s the catch? Why am I practically giving this training course away?
Well, it’s really quite simple. Since you�re being trained directly from the internet, I do not have to incur rental course for the lab and no fulfillment costs. I don�t need to pay anyone to take the orders over the phone (though, you are welcome to call me at (65) 9630 0917 to rest assured that I am a real person). This way I can pass along my cost savings to you. So you win and I win.
100% Risk-Free Guarantee:
Your success in using “Sales Performance Analytics with Excel is completely guaranteed. In fact, here’s my 100% Better-Than-Risk-Free-Take-it-To-The-Bank Guarantee:
| I personally guarantee that if in the next 56 days (8 weeks), you honestly believe I haven’t delivered on this promise, then let me know and I’ll issue you a prompt and courteous refund. |
Is that fair or what?
That means you can access the whole collection of videos at my risk, while you see if they work for you or not. And if you’re not 100% satisfied, I honestly want you to ask for your money back.
There is absolutely no risk, whatsoever on your part. The burden to deliver is entirely on me. If you don’t learn anything new from “Sales Performance Analytics with Excel” then I’m the loser, not you.
Look at it this way — $47.00 is really a painless drop in the bucket compared to the time you’re going to save on preparing those reports. That’s why…
You Really Can’t Afford Not To Invest InSales Performance Analytics with Excel!
It’s easy to get started right away. Just Click Here and you can have immediate (and unlimited) access to all of the videos in Business Analysis with Microsoft® Excel.
Get ready to turn your data into valuable informative reports and impress your audience with it.Order Now!
 Sincerely, Jason Khoo SynergyWorks |
P.S. You’ll be amazed at how simple and easy it is to apply all of these techniques. The videos will allow you to begin immediately – even before you start working on the next monthly report!
(Order now through our Secure Server, and get instant access!)Click Here Now!

Testimonies
I used to sieve duplicate records manually but now I can use advanced filter to do that.
Herman estimates that he only needs to spend about 20% of his time working on those excel related task as compared to before.”
Herman has 4 years of experience using Excel. He uses excel 3 times a week.Organisation : Mondial Assistance Singapore
I have learnt how to use formula like VLOOKUP, COUNTIF etc. which I never know excel is so powerful to do so many stuff.
Sandy estimates that she only needs to spend about 60% of her time working on those excel related task as compared to before.”
Sandy has 6 years of experience using Excel. She uses excel 5 times a week.Organisation : W L Gore & Associates
I learn how to use macro recording to shorten the time taken to do certain task.
Vincent estimates that he only needs to spend about 80% of his time working on those excel related task as compared to before.”
Vincent has 2 years of experience using Excel. He uses excel 5 times a week.Organisation : Persimmon Ridge Investment Pte Ltd
Whole course is indeed a beneficial one. ALThough I use Microsoft® Excel almost everyday at work, little do I know excel can make wonders with the little icons you can see on the screen.
Philo has 10 years of experience using Excel. She uses excel 5 times a week.Organisation : Eltra Aeronautics (S) Pte Ltd
1) Used to slowly scroll from top to bottom or vice versa. Now I know how to use the shortcuts.
2) Learnt how to create “forms” in Excel.
3) Learnt how to update data in both Access and Excel.
Jasmine estimates that she only needs to spend about 50% of her time working on those excel related task as compared to before.”
Jasmine has 6 years of experience using Excel. She uses excel 5 times a week.
Organisation : National Council of Social Service
I used to delete selected fields row by row in a database of 50,000 rows. From SynergyWorks: She learn how to delete the rows all at one go.
Winnie estimates that she only needs to spend about 20% of her time working on those excel related task as compared to before.”
Winnie has 8 years of experience using Excel. She uses excel 5 times a week.Organisation : National Council of Social Service
I used to sort data manually. After this training, pivot table has benefitted me in time savings.
Susan estimates that she only needs to spend about 10% of her time working on those excel related task as compared to before.”
Susan has 2 years of experience using Excel. She uses excel 5 times a week.Organisation : Philips Electronics Singapore
a) Apply formula to the whole column without using copy and drag.
b) Use to count manually by rows – now I use countif
c) Using macro to carry out repeat functions.
Alice estimates that she only needs to spend about 70% of her time working on those excel related task as compared to before.”
Alice has 5 years of experience using Excel. She uses excel 3 times a week.Organisation : Temasek Polytechnic
I have learnt to analyse the data in a more efficient manner using the countif, subtotal formulae.
Dawn estimates that she only needs to spend about 30% of her time working on those excel related task as compared to before.”
Dawn has 5 years of experience using Excel. She uses excel almost every workday.Organisation : Prefer not to disclose
Before this course, I only know the basic of Excel. Did not know that actually, there are so many formats we can use to cut short the time to obtain the results. One specific example is the pivot table which I get to learn is useful for my presentation
Sock Moon estimates that she only needs to spend about 50% of her time working on those excel related task as compared to before.”
Sock Moon has 8 years of experience using Excel. She uses excel 5 times a week.Organisation : Philips Electronics Singapore
“I have a big workbook and I keep increasing the worksheets depending on demand and requirement. Now I would just have to try to use pivot table.”
JoAngie estimates that she only needs to spend about 80% of her time working on those excel related task as compared to before.”
JoAngie has 10 years of experience using Excel. She uses excel all day long for reporting / daily records / schedules.Organisation : Heineken Far East Pte Ltd.
“I used to manually calculate subtotal at the end of each section. Now I can use the subtotal function to do it.”
Note from SynergyWorks: Subtotal function is different from subtotal formula.
Anna estimates that she only needs to spend about 60% of her time working on those excel related task as compared to before.”
Anna has 10 years of experience using Excel. She uses excel 3 times a week.Organisation : Danfoss Industries Pte Ltd.
Testimonies
“I learnt many shortcuts and functions that I didn’t know of. This course is most beneficial to people who handle huge data and want to manage it well.
Companies should have a customized excel course conducted by this trainer that matches their needs – will certainly result in time/cost savings and efficiency.”
Maggie has 6 years of experience using Excel. She uses excel 3 times a week.Organisation : Sumitomo Corporation (S) Pte Ltd
“I am able to use pivot table to monitor the product and total purchase. I know how to make use of formulas for different type of requirement. I have a better understanding on macros.”
Wendy has 5 years of experience using Excel. She uses excel 5 times a week.Organisation : Sumitomo Corporation (S) Pte Ltd
“I learn how to use pivot table, leverage and discover useful shortcuts (e.g. double click cross at the bottom right, end bottom and make use of the FindAll function”
Gwyneth has 8 years of experience using Excel. She uses excel 4 times a week.
“I used to just sorting data using “sort”. Now, can apply the filter function to better arrange data info.”
Val has 4 years of experience using Excel. She uses excel 2 times a week.Organisation : National Council of Social Service
“The course has helped to save time and headaches. Now able to split comments into multiple cells. No more MANUAL re-entry”
Glenn has 10 years of experience using Excel. He uses excel 8 times a month.Organisation : National Council of Social Service
“I used to input data manually. Now I can create a dropdown list for a list of similar data”
Karen has 2 years of experience using Excel. She uses excel everyday.Organisation : National Council of Social Service
“I used to take a long time to churn out data, but with the help of pivot table/charts, I am able to churn out useful dat/information within a shorter time period.”
Alenzia has 5 years of experience using Excel. She uses excel everyday.Organisation : National Council of Social Service
“I didn’t even know there’s such a thing as “Pivot Table” previously. Now I know how to use it effectively.”
Sheena has 3 years of experience using Excel. She uses excel 5 times a week.Organisation : National Council of Social Service
“Lots of shortcuts such as visible cells selection, Ctrl + End + ‘arrow key’. Pivot table and chart will be very useful in doing my reporting.”
Chantel estimates that she only needs to spend about 80% of her time working on those excel related task as compared to before.”
Chantel has 6 years of experience using Excel. She uses excel 5 times a week.Organisation : Choose not to disclose.
“I have gained a greater understanding for pivot table. Get to know how to scroll to the end of the file.”
Yen Yen has 3 years of experience using Excel. She uses excel everyday.Organisation : Marketing Institute of Singapore
“Before this course, I would manually edit spreadsheet. Now, I learnt to use Auto-Filter to help me filter data and do formatting using “Visible Cells Only”
Shirley estimates that she only needs to spend about 50% of her time working on those excel related task as compared to before.”
Shirley has 10 years of experience using Excel. She uses excel 2 times a week.Organisation : East West Executive Travellers Pte Ltd.
“From the school list. Very good – save a lot of money.”
School list was a request made by Shirley to convert data copied from the website into a mailing list.
Shirley has 10 years of experience using Excel. She uses excel everyday.Organisation : National Council of Social Service
“Setting up formula to search for data.”
May has 4 years of experience using Excel. She uses excel 4 times a week.Organisation : National Council of Social Service
“‘Text to Column’ was especially beneficial since I download the data from the system. I used to change the data manually.”
Leo Murshige has 6 years of experience using Excel. He uses excel 4 times a week.Organisation : Danfoss Industries Pte Ltd