Tracking personal expenses
I always thought tracking your expenses and financial planning is important regardless what your income level is. Personally I love Excel so I have developed an Excel template to track my personal expenses. I feel Excel is a perfect tool to do this. Here is how I designed my template:
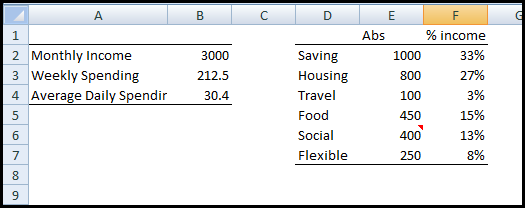
I created 3 worksheets and use them for planning, data recording and dashboard respectively. In the planning tab, I use very simple formulas to get a general idea how I want to allocate my salary for different purposes. I also get an idea how much I should spend each week.

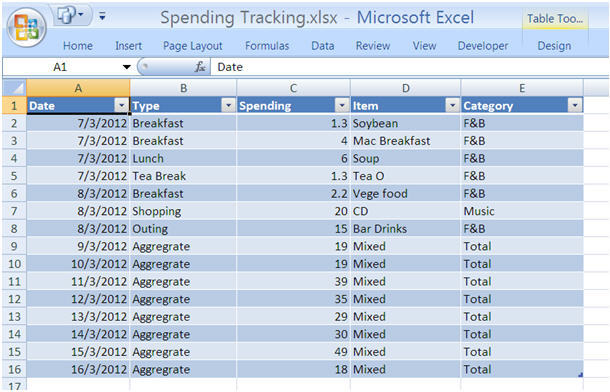
Next, in the actual tab, I record my daily spending. Sometimes I track record details, but sometimes I just record the total amount I spent as I could not really remember where I spent the money. I also track the category and type of spending so I will know how to adjust my spending in the long run. Of course you can decide what you want to track according to your own needs. However the date and total daily spending shall be two necessary piece of information. One important thing I did was to convert the recording area into a table, as it gives me automatic formatting once I add a new record and allow me to create a dynamic range when I create a dashboard to monitor my spending trend, which I am going to talk about next.

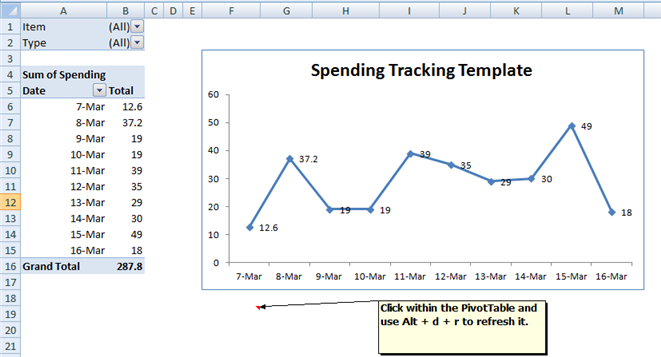
In the “Dashboard” tab, I simply create a PivotChart based on the table in the “Actual” tab where I record my spending. Then I just drop the date into the Axis Field and Spending into the value Field and choose a line chart to show my data. The wonderful part of the design is that the chart is dynamic and I do not have to use any formula to aggregate any data. PivotTable does all the aggregation for me and all I need to do is to refresh the PivotTable to include my newly added spending data in the “Actual” tab. Refreshing the PivotTable is easy: simply click within the PivotTable and use short cut key “ALT+d+r”. Of course you can also go to the ribbon to refresh it.

Once the template has been set up, everything is easy and fast. Now tracking my expense is really 3 simple steps:
1.Think about where I spent the money,
2. Record it in the “Actual Tab”,
3. Refresh the PivtotTable in the “Dashboard” tab.
Then I can sit back and look at a nicely plotted chart. The entire design practically needs almost zero knowledge of formulas. All you need is to click, drag and drop. This is the beauty of Excel.
written by Zhang Da
